Every business wants to grow. As many entrepreneurs have discovered, scaling up is hard to do. As you try scaling your subscription business, it’s important to have a firm grasp of your strengths so you can leverage them as you grow. Obviously, you would want to look into past financial trends to help guide future plans.
While looking at your financials is a good start, they don’t always give you the nitty-gritty details that you can use to derive important business insights. This is especially true in a subscription-based business. Fortunately, there is a solution. Utilizing the reporting function of your recurring billing software is one way to get a better picture of those strengths and weaknesses that will help you chart the scalable path forward.
Stax Bill product architect Serge Frigon breaks it down into the four reporting pillars: sales, cash, revenue, and monthly recurring revenue (MRR). With a long history in billing software systems, including his 8+ years with Stax Bill and 11 years with software pioneer Protus IP, Serge has a first-hand view of how important financial insights can be to the health of a company.
1. The sales pillar
The sales pillar refers to the money that is owed by customers recorded on an invoice. “Think of it as the grand total of potential cash that you will eventually collect and recognize as revenue,” says Serge.
Once the payment is successful and the money owed is collected, sales and cash become identical. However, keeping track of your sales is still important in case there are any issues with payment, like an expired credit card or a lack of funds. In the event that issues like these arise, it’s important to have a record of what each customer owes your business.
There are also a few different ways you can segment and analyze the data to provide a good overview of what’s going on with your business and customers.
1. Sales by month.
When looking at sales data for any particular month, you can see which days your invoices are being issued.
According to Serge, when companies first set up manual recurring billing, they often find it’s easier to have all clients invoiced on the same day of the month. This is not always a good thing though. When your business starts to scale, it can become a nightmare for your billing clerks when all your customer processing is focused on a single day instead of being evenly distributed throughout the month.
In such a scenario, not only would it be near impossible for the billing clerks to invoice every customer on the same date, but it would also leave them with nothing to do for the rest of the month.
Billing solely at the beginning or end of the month gets further complicated when new customers sign up at any other time besides the first or last day of the month. When this happens, these new customer sign-ups would need to be pro-rated to the next first of the month, so they aren’t paying for a full month of services that they aren’t using.
This billing pro-ration is difficult to do though and many businesses end up taking shortcuts by not charging these customers for the first month. Which means that if a customer signs up for a monthly plan during the second week of the month, they would be getting around three weeks for free until the following month begins.
By not pro-rating their billing, businesses thus end up losing money (revenue leak). A way to avoid all of this is to have distributed billing dates, which allows you to invoice customers on different days throughout the month.
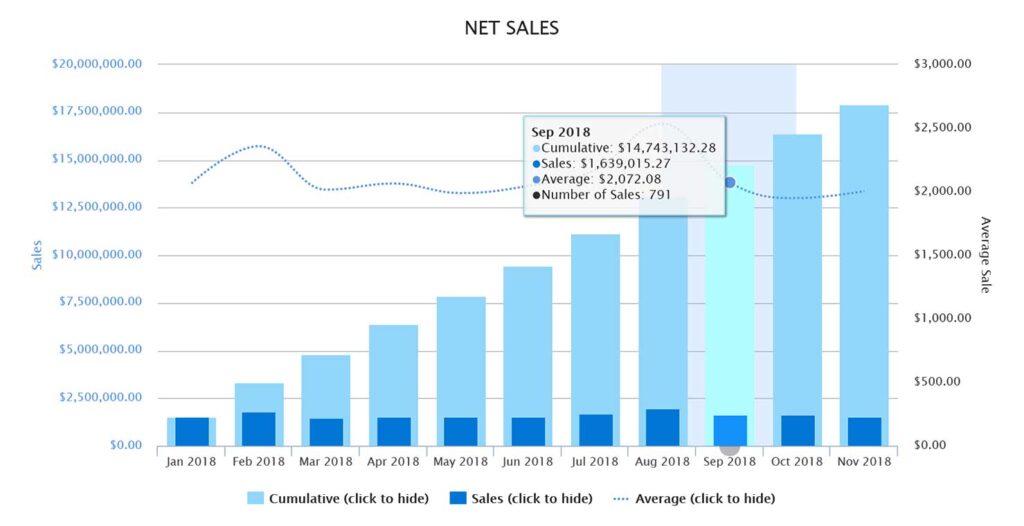
2. Sales by year.
This report allows you to look back and see the total number of sales issued every month for the whole year along with the average price paid by customers. The monthly average will typically be steady throughout the year, unless you are offering numerous discounts to your customers and billing them for different amounts throughout the year.
3. Long-term sales data.
Looking at the data for longer periods (18 to 36 months) really allows you to see how much your business is growing every quarter. Armed with this information, you can detect any trends with your average invoice amount. Limit your criteria to activity within the past few years, though. Once you start looking beyond around three years’ worth of data the numbers start to lose their meaning.
4. Sales by customer.
By breaking down the data this way, you can see what percentage of sales are coming from your top customers. If a high percentage of sales are coming from just this small group, it’s a good idea to mitigate risk by diversifying your clients in case your top customers go out of business or decide to take their business over to your competitor.
5. Sales by activation cohort.
The activation cohort refers to a group of clients that all became customers during the same calendar month. By sorting your sales data by activation cohort, you can easily see how much these customers are contributing every month after their initial sign up. This insight will allow you to:
– monitor contributions made by historical customer
– track annual retention rates and trends in your 2nd month
– see the impact of sales churn compared to customer churn, and
– take proactive steps to mitigate against churn
6. Sales by plan or product.
Breaking down your sales by the different plans or individual products that your business offers will give you an indication of what plans and products are the most popular, and which ones aren’t moving very well. This can tell you what products you should be focusing on and what plans or products you might want to consider discontinuing.
7. Sales by GL (general ledger) code.
This is when you group similar products into different categories for reporting purposes. This is a good way for your marketing team to get a feel of what’s working and what isn’t.
2. The cash pillar
The cash pillar is all about the payments you have received from your customers. While it’s a given that you should be keeping tabs on the payments that are coming, it’s also important to know where exactly these payments are coming from and how your customers are paying for their services.
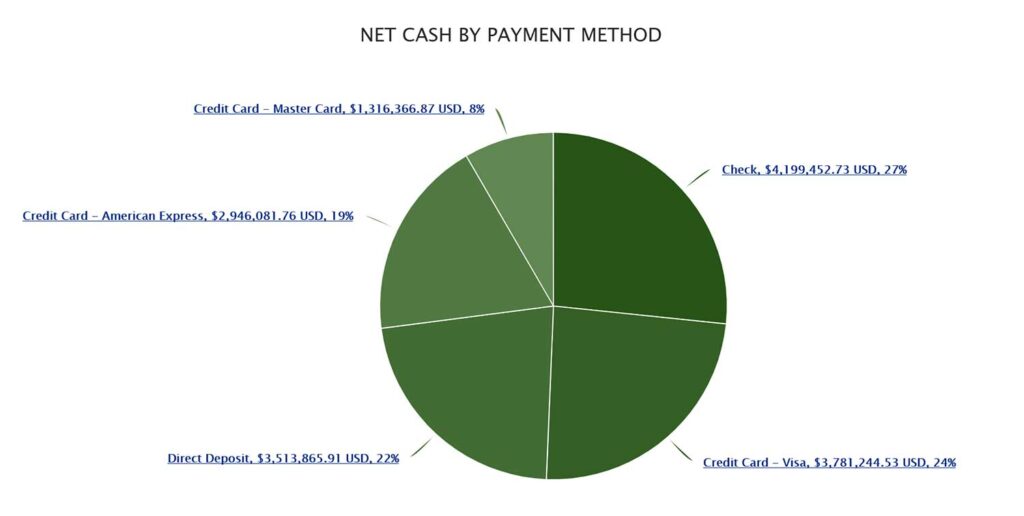
One good reason you’d want to pay attention to such details around the payments coming in is that certain payment methods are more expensive than others. For example, transactions involving credit cards will cost more to process than ACH (Automatic Clearing House) payments. So, if you have a significant number of transactions being paid by credit cards, you might consider developing a program to migrate as many credit card users to pay by ACH.
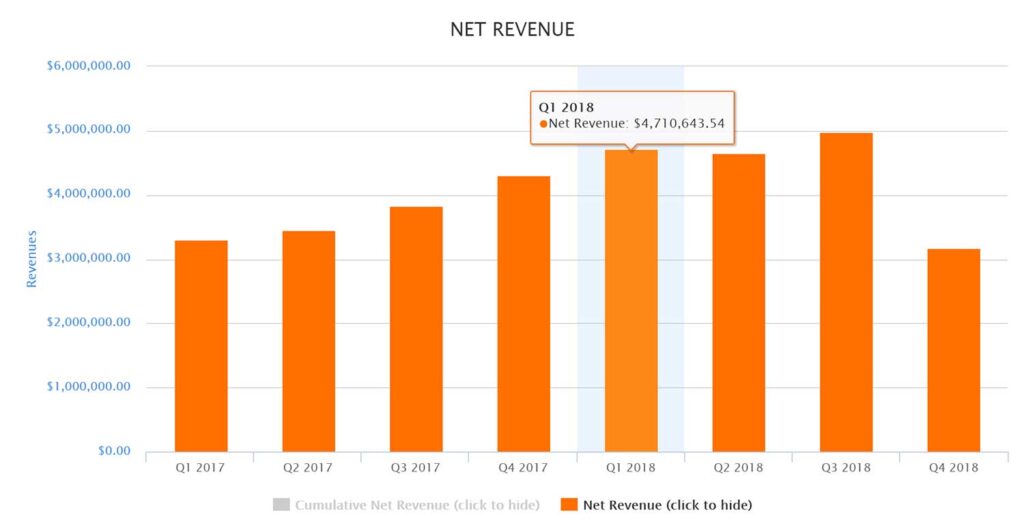
3. The revenue pillar
This pillar is about recognizing revenue over the course of the service period.
For example, when Netflix charges you $10 per month for unlimited streaming, they owe you access to their services for one full month. Since they still owe you services for the coming month, they can’t recognize that $10 as revenue right at the time of sale. What they can do is immediately recognize $.033 of that $10. Every subsequent day throughout that 30-day period, they can continue to recognize $.033. By the end of the month, they can recognize the full $10 paid by the customer as revenue.
While tracking rev rec—revenue recognition—may not be a priority for massive companies like Netflix that offer only monthly subscriptions, the recognition of revenue is critical for businesses that offer their customers both monthly and annual subscriptions. Especially when a customer cancels their annual subscription part-way through the service period.
Serge explains that this is a “very critical piece of information,” as companies pay corporate tax based on the number of sales. Therefore, when they close their books at year-end, it’s crucial that they know exactly what their outstanding deferred revenue liability is for the coming year.
Another important thing Serge says to keep in mind is that you “only want to recognize the revenue at the appropriate times.”
Let’s say you make a sale with a big client right around year end when you’d file your corporate taxes. You wouldn’t want to pay taxes on the complete amount of that new sale when you still owe the customer services for a certain period of time.
4. The MRR (Monthly Recurring Revenue) pillar
Unlike the other three pillars mentioned above, MRR is not a GAAP (Generally Accepted Accounting Principles) metric. It’s a special measurement used to track the performance and growth of a recurring billing business. MRR is one of the most important SaaS (Software as a Service) metrics and KPIs, or Key Performance Indicators. In simple terms, MRR is the monthly revenue coming from all active recurring subscriptions. It combines annual and monthly subscriptions as a single measurement.
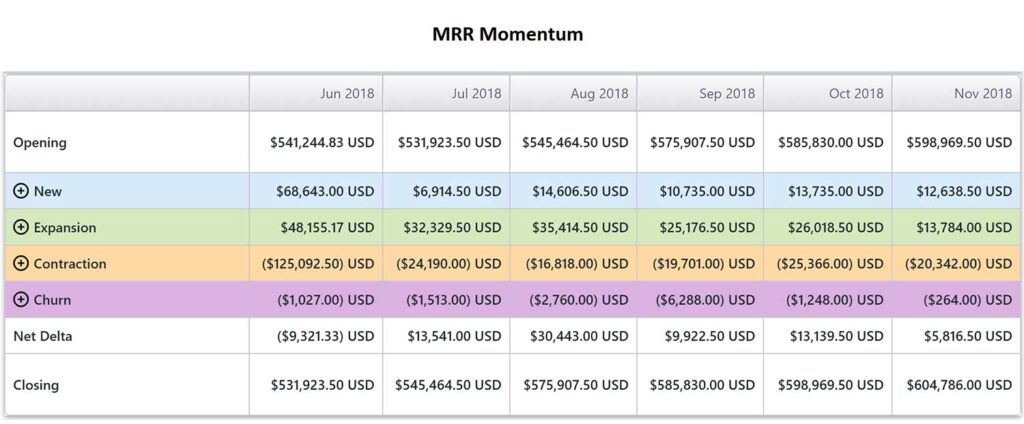
In other words, a $10 per month subscription would have a $10 MRR value and a $120 per year subscription would also have a $10 MRR value. Therefore, if in one month, your company signs up a customer for a $10/month plan and another for a $120/year plan, your MRR growth is 20. Assuming those customers never leave, never churn and no new customers come along, eventually, your regular amount of money that will end up getting recognized as revenue in the future will always be $20.
In reality, new customers will always be signing up and existing customers will leave. Due to this, your MRR will constantly be under downward or upward pressure. So, by tracking this value, you can clearly see if you are growing or contracting and by how much as a percentage. MRR is especially useful for CEOs and CFOs as it is a great way to summarize financial results to investors and other decision makers.
All four pillars will tell you something different about your business. It’s important to look at each one analytically if you want to successfully scale your business and succeed with a recurring billing model. Doing so will allow you to project future revenues, but will also help you to clearly see what’s working and what isn’t empowering you to make strategic decisions going forward.
As Serge says,
Looking at the data for each of these four pillars not only allows you to be proactive in tracking your customer data but gives you a crystal-clear idea of what’s going on with your business and customer base.
Serge Frigon
Product Architect, Stax Bill